Deep learning with AR cartoons
This is a continuation of the 2D-to-3D AR cartoons project. Different DL methods were applied to the 2D-to-3D pipeline to improve or extend the existing capabilities. This was the topic of my master’s thesis and implemented in Java on Android with ARCore, jMonkeyEngine and TensorFlow.
Ideas
There were three different ideas on how to integrate DL.
- Apply suitable animations to generated objects with classification
- Improve detection capabilities with DL based contour detection or segmentation
- Automatically rig the models with a fitting skeleton
This resulted in an extended pipeline which adds the classification and automatic rigging steps into the process. In addition, the segmentation step can use the classic segmentation, DL based contour detection or DL based segmentation.
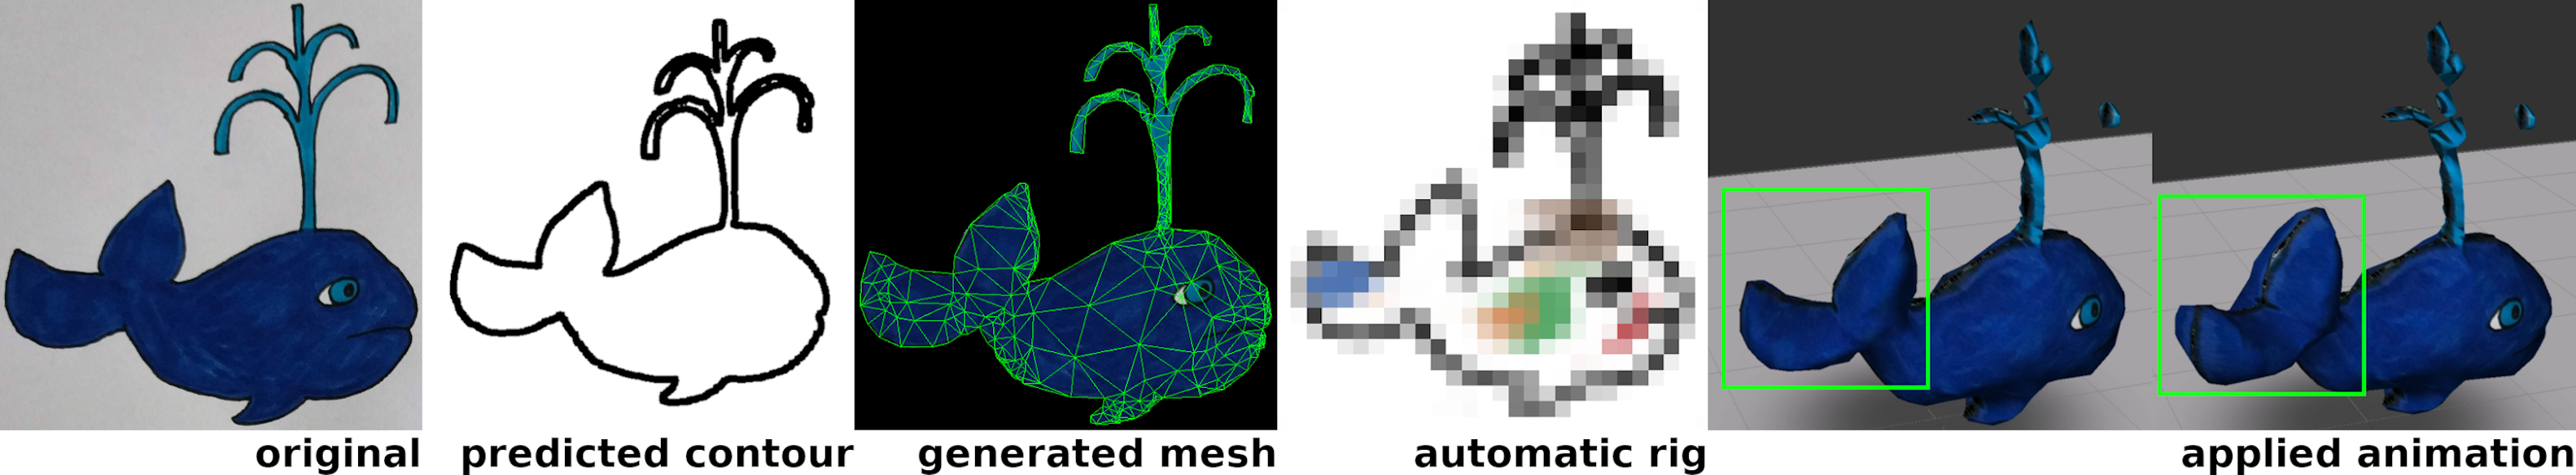
1. Input image. 2. Generated contour. 3. Generated mesh.
4. Classification and generated automatic rig. 5. and 6. Play the applied animation.
Classification
In order to increase the immersiveness of the AR scenes, the drawn objects should have suitable animations applied to them.
To achieve that, the googlecreativelab/quickdraw-dataset was used as the base dataset. It features a lot of different classes with adequately child-like drawings. From these classes, 95 suitable for animation were selected. These were then further grouped into different types of locomotion (bipedal, winged). Each locomotion can have multiple animations assigned to it and each animation has an associated skeleton. These were kept as simple as possible to reduce the amount of necessary rigging.
For the classification a simplified AlexNet [1] CNN architecture was trained with 11000 images per class. It only uses the detected contours of the drawing to find the matching class. Although the dataset is limited to quick mouse sketches, it generalized pretty well for real drawings.
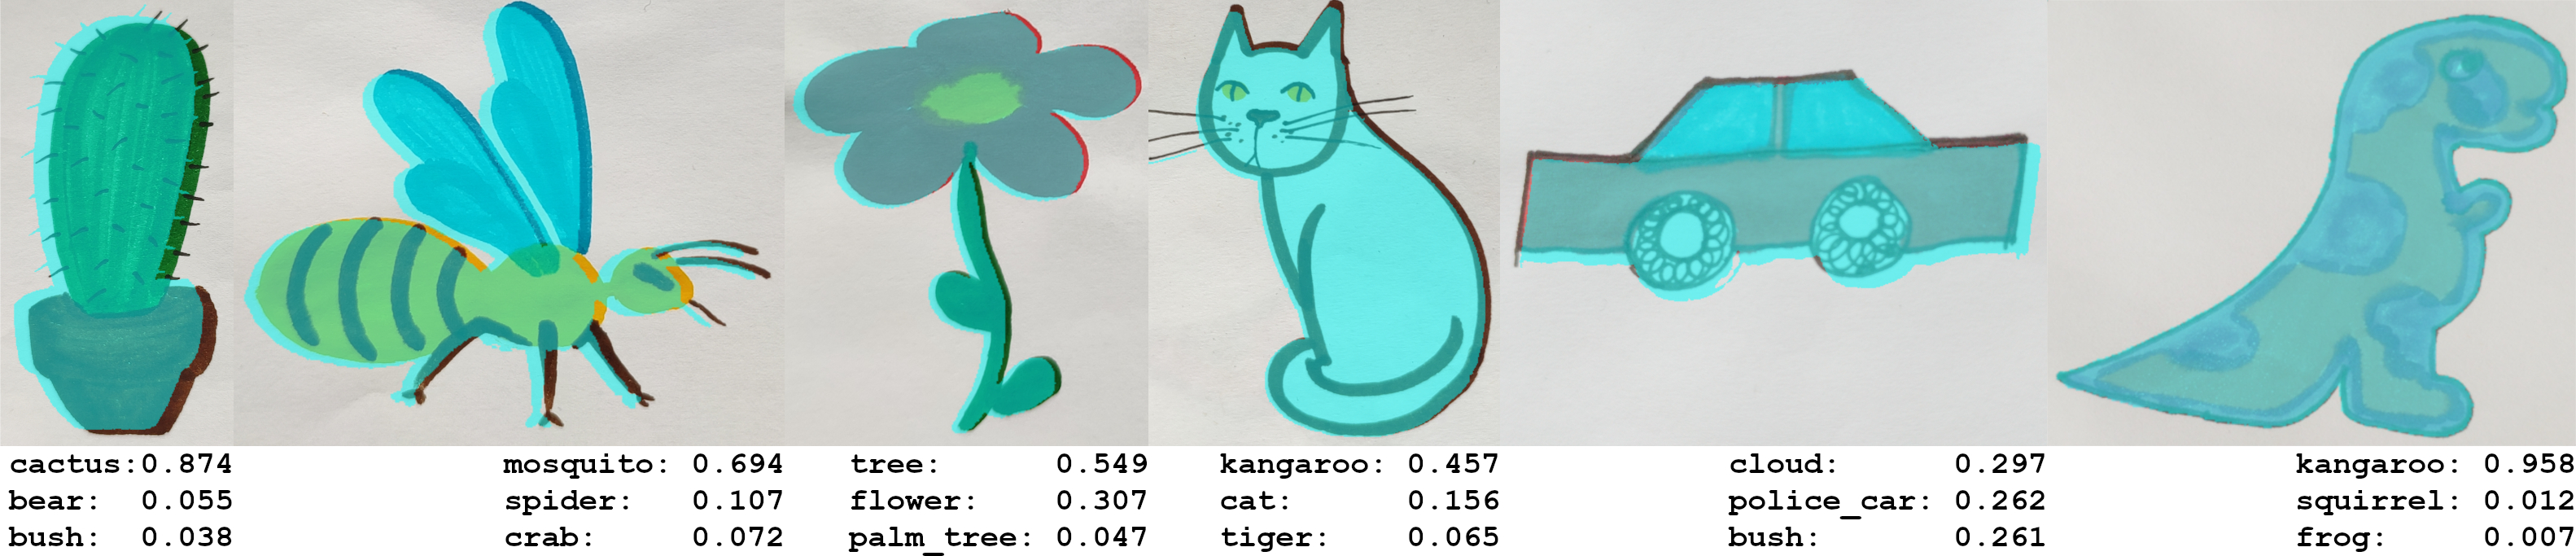
The top three classes are shown below each of the drawings. The blue area is the detected segment, whose outline is used for the classification.
Contour detection and segmentation
To improve the drawing detection two different approaches were taken. First, the outline detection step should be replaced by a DL contour detection approach. As a base dataset the BSDS500 with some augmentations was used. The network architecture itself was based on the Holistically-nested Edge Detection [2] CNN with variable VGGNet [3], MobileNet [4] and MobileNetV2 [5] backends. Results from the network are then processed as before in the segmentation pipeline. Second, the whole segmentation process should be replaced by a DL based one, with training based on the VOC2012 dataset. Here, the architecture was based on U-Net [6], with integrated depthwise separable convolutional blocks (as in MobileNet) instead of normal convolutional blocks.
While the contour detection replacement worked pretty well, the DL based segmentation did not perform as expected. With the HED based CNN the input drawings could vary more in quality, definition and circumstances compared to the previous method, no black outlines were necessary anymore.
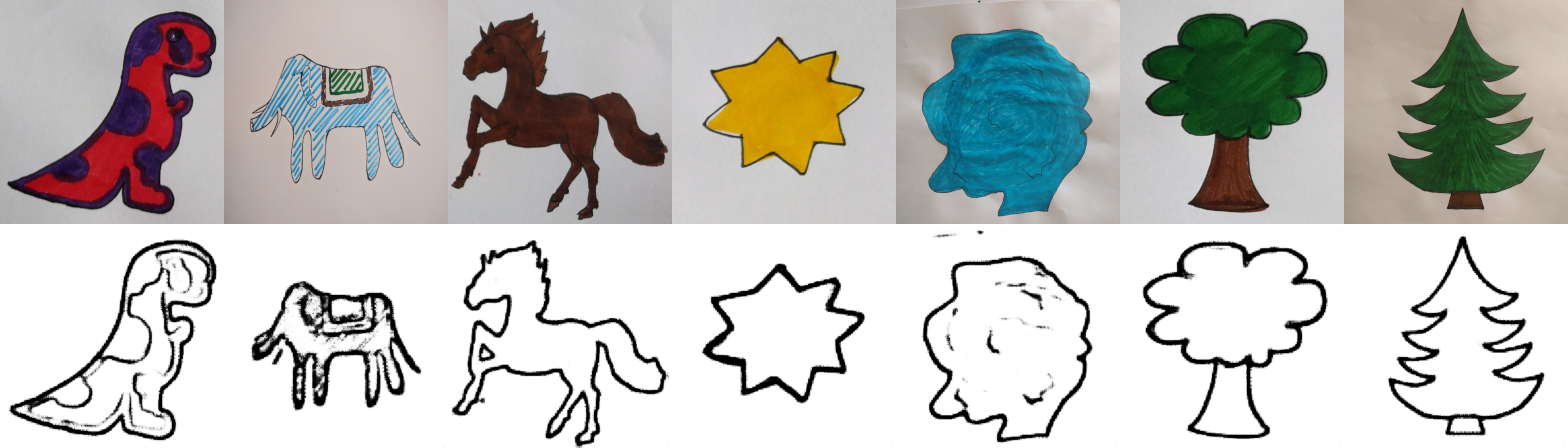
The predicted contours are the same or better for ideal images.
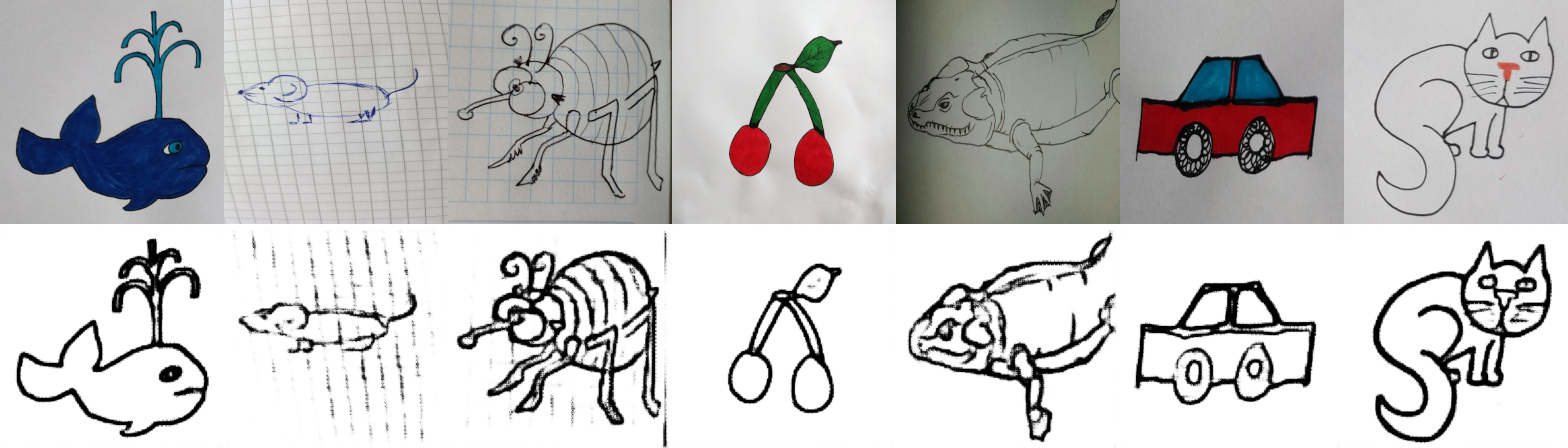
Even less ideal, line only or drawings on graph paper are detected sufficiently.
Automatic rigging
At first the rigging process was manual and required user input and knowledge for the positioning of the joints.
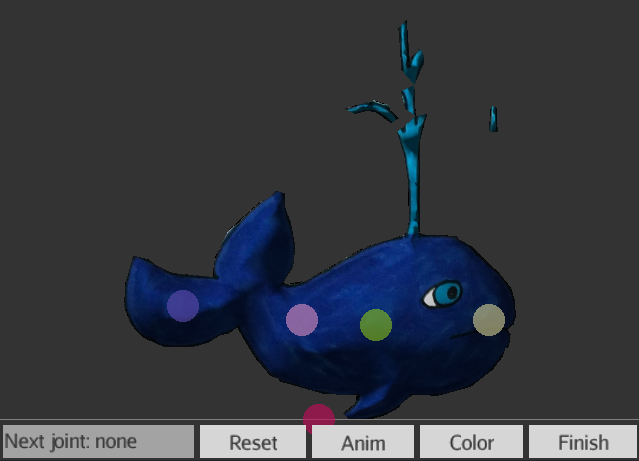
The manual rigging process.
In order to test whether this can be automated, some skeletons of animations for the “swimming” locomotion were selected and drawings from the Quick, Draw! dataset manually labelled accordingly. The idea was to use the previously created segmentation network to produce a probability map for each of the joints. Instead of outputting only foreground and background classes, each joint is mapped to one class.
The results for simple skeletons (up to 6 joints) were pretty promising, the probability maps resulted in well placed joints. However, the “one skeleton per animation” approach proved as particulary bad for this application, as each animation/skeleton needs an associated trained network and dataset.
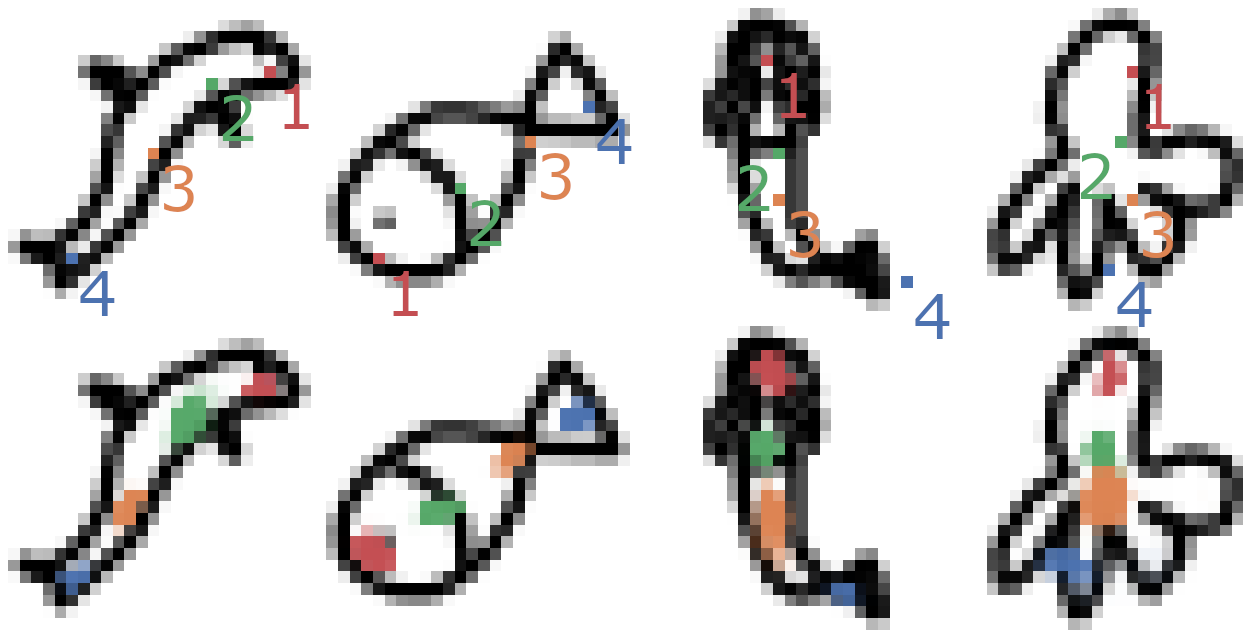
The top row shows a potential desired rigging, the skeleton consists of 4 linearly connected bones.
The bottom row shows the predicted probabilities for rigging positions.